May 2024
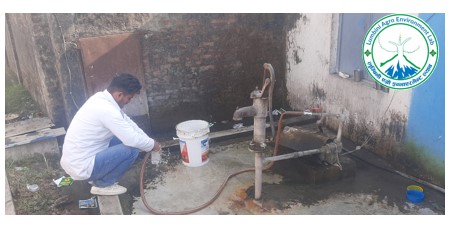
Sarawal Rural Municipality (SRM) in Nawalparasi West relies almost entirely on shallow and medium‑depth hand‑pumps for domestic water. In response to frequent community complaints—gastro‑intestinal outbreaks during monsoon, metallic taste, scaling in utensils and visible turbidity—the Ward Office commissioned Lumbini Agro Environment Laboratories to carry out a comprehensive physicochemical and bacteriological survey. A total of 102 point sources were sampled in April 2025, covering the three main settlements of Khokharpura, Tilakpur and Bhagda (91 hand‑pumps) and the piped ward‑level distribution scheme (11 taps, reservoirs and stand‑posts). The present document synthesises the field data (see annexed spreadsheet) and benchmarks them against the National Drinking‑Water Quality Standards of Nepal (NDWQS 2079 B.S) and the WHO Guidelines for Drinking‑Water Quality (2022).
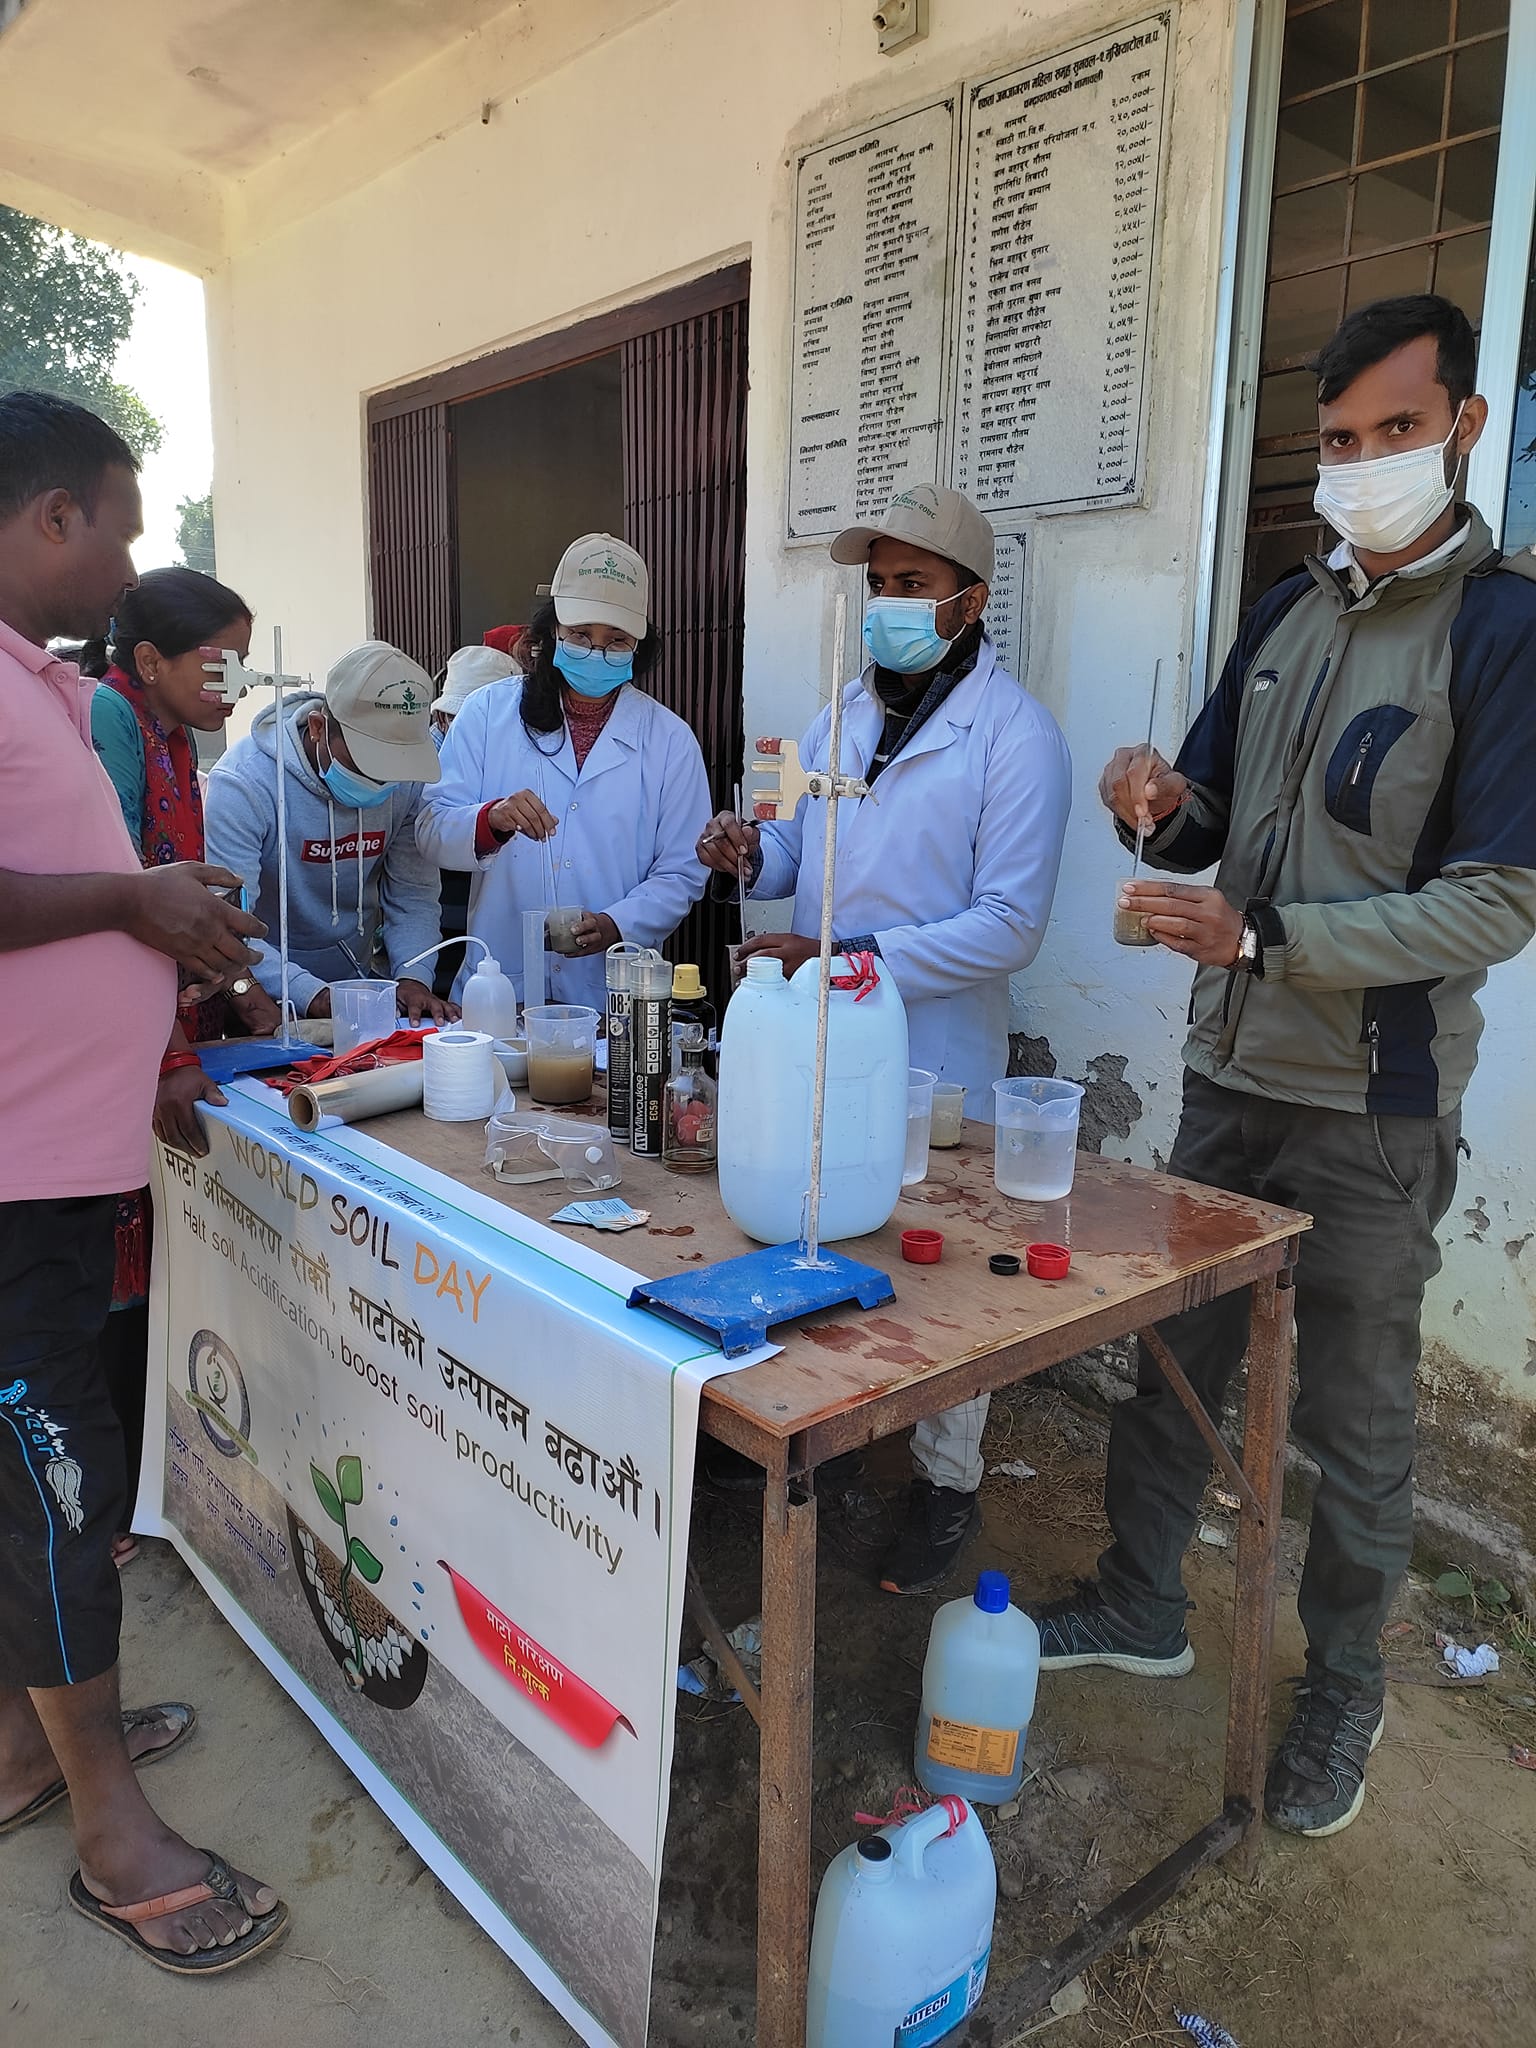
2 | Sampling & Analytical Overview
Water was collected in sterile 1 L polyethylene bottles following APHA 23rd Edition procedures. In‑situ measurements (pH, temperature, electrical conductivity / EC) were recorded with calibrated probes. Turbidity was assessed by nephelometry; total dissolved solids (TDS) were derived from EC; free chlorine was determined by the DPD colorimetric method. Alkalinity and hardness were titrimetrically measured with standard acid and EDTA solutions, while iron was quantified by UV–vis spectrophotometry (phenanthroline complex at 510 nm). Arsenic was screened by the SDDC method with a detection limit of 0.001 mg L⁻¹. Faecal contamination was evaluated via membrane filtration on m‑ENDO agar; results are expressed as total‑coliform colony‑forming units per 100 mL (CFU / 100 mL). The laboratory categorised counts >100 CFU/100 mL as uncountable (heavily contaminated).
3 | Physicochemical Results
3.1 pH & Temperature
- Range: 6.7 – 7.8
- Mean: 7.2 ± 0.25
- None of the samples fell outside the NDWQS acceptable window (6.5–8.5).
Groundwater temperature averaged 30.4 °C, typical for pre‑monsoon Terai aquifers and with minor relevance to potability.
3.2 Turbidity
- Standard: 5 NTU (desirable), 10 NTU (maximum, NDWQS)
- Exceedances: 29 / 102 (28 %) exceeded 5 NTU; 14 / 102 (14 %) topped 10 NTU, primarily in Khokharpura and Tilakpur cluster where iron precipitation and fine sand intrusion are common.
3.3 Total Dissolved Solids (TDS) & Electrical Conductivity (EC)
- TDS range: 244–1,042 mg/L (Mean = 496 mg/L)
- Twelve hand‑pumps (11.7 %) breached the 1,000 mg/L aesthetic guideline; all belonged to the deeper iron‑rich horizons of Khokharpura.
- EC range: 402–1,930 µS cm⁻¹. Ten samples >1,500 µS cm⁻¹ indicate moderate salinisation risks, probably from evaporative concentration and local agro‑chemical return flows.
3.4 Hardness & Alkalinity
Total hardness varied between 64 mg/L and 713 mg/L as CaCO₃. Fifty‑four percent of the pumps produced water classified as hard (>300 mg/L), with the highest values once again clustering around Khokharpura’s older tube‑wells. Alkalinity showed parallel trends (152–561 mg/L), reflecting carbonate buffering of these alluvial aquifers.
3.5 Iron (Fe)
- Range: 0.239–0.318 mg/L
- Standard: 0.3 mg/L (NDWQS aesthetic limit)
- Exceedances: 18 samples (17.6 %) surpassed the guideline, giving rise to rusty taste, reddish staining and elevated turbidity.
3.6 Arsenic (As)
All values (0.000–0.068 mg/L) fell below the national health limit of 0.05 mg/L; the dataset therefore confirms absence of arsenic hazard in Ward 1.
4 | Bacteriological Quality
The single most critical parameter was total coliforms. Of 102 sources:
- “Uncountable” >100 CFU/100 mL: 63 sources (61.8 %)—all categorically unsafe.
- Detectable (1–100 CFU/100 mL): 11 sources (10.8 %)—also unsafe per NDWQS which stipulates 0 CFU/100 mL.
- Zero coliforms: 28 sources (27.4 %)—principally newly bored hand‑pumps or taps supplied by elevated reservoirs disinfected with bleach.
A higher incidence of microbial contamination was recorded in hand‑pumps with damaged concrete aprons, missing discharge spouts or poor drainage, supporting established links between sanitary integrity and microbial intrusion.
5 | Spatial Patterns
Khokharpura exhibited the worst combined profile: high iron, excessive hardness and the greatest proportion (72 %) of coliform‑positive samples. Tilakpur shared similar bacteriological issues but had slightly lower mineralisation. Bhagda surprisingly recorded better physicochemical indices—TDS averaged 460 mg/L—but bacteriological contamination remained pronounced (60 %). The piped distribution system fared best, with only three taps showing >0 CFU/100 mL and all remaining chemical parameters well inside limits—attributable to periodic chlorination and deeper bore sources.
6 | Compliance Snapshot
| Parameter | National Limit | % Samples Complying | Major Hot‑spots |
|---|---|---|---|
| pH | 6.5–8.5 | 100 % | n/a |
| Turbidity | ≤5 NTU | 72 % | Khokharpura, Tilakpur |
| TDS | ≤1,000 mg/L | 88 % | Khokharpura |
| Hardness | ≤300 mg/L | 46 % | Khokharpura, Bhagda |
| Iron | ≤0.3 mg/L | 82 % | Khokharpura & Tilakpur deeper pumps |
| Arsenic | ≤0.05 mg/L | 100 % | n/a |
| Coliforms | 0 CFU/100 mL | 27 % | All three clusters (hand‑pumps) |
Overall, only 18 sources (17.6 %) satisfied every national parameter simultaneously.
7 | Health & Socio‑economic Implications
- Microbial risk: The predominance of faecal indicators signifies a high probability of pathogenic bacteria, viruses and protozoa. Epidemiologically, this correlates with seasonal spikes in diarrhoea and typhoid noted by the local health post.
- Chemical risk: While iron and hardness pose chiefly aesthetic and plumbing issues, their synergy with turbidity can protect microbes from chlorination, further aggravating sanitary risk.
- Vulnerability clusters: Households of the Dalit and landless Tharu communities, especially those in Bhagda’s low‑lying fringes, use older hand‑pumps with compromised seals, rendering them disproportionately exposed.
8 | Causal Factors
- Shallow aquifers (<30 m) intersecting unconfined sand lenses facilitate rapid percolation of surface contaminants.
- Latrine proximity—field reconnaissance revealed >60 % of pumps within 10 m of pit latrines or cowsheds.
- Lack of periodic chlorination or wellhead disinfection following repairs.
- Iron–manganese incrustation decreasing bore efficiency and encouraging biofilm formation.
- Agricultural runoff (urea, potash) explaining elevated EC in Khokharpura vegetable belts.
9 | Recommendations
- Priority Rehabilitation: Seal and raise well platforms; ensure concrete aprons with outward drainage for the 63 “uncountable” sources.
- Household‑level Treatment: Promote three‑pot sand filters or biosand units; subsidise 0.5 % NaOCl solution for weekly dosing.
- Cluster Chlorination: Mandate monthly super‑chlorination of distribution reservoirs; maintain free chlorine residual of 0.5 mg/L at taps.
- Routine Monitoring: Establish ward‑level water‑quality surveillance every quarter—microbial and iron focus.
- Deeper Bore Conversion: Where geologically feasible, sink new tubewells >45 m tapping confined aquifers with lower microbial load and iron.
- Behavioural Change: Conduct hygiene education linking latrine siting, waste disposal and pump sanitation.
- Iron Removal Units: For high‑iron clusters, install community‑scale aeration–sedimentation–sand filtration systems.
- Data Integration: Upload results to the National Drinking‑Water Information System (DWSSM) for policy planning and donor engagement.
10 | Conclusion
The survey highlights a dual challenge for SRM Ward 1: severe bacteriological contamination and localized mineral (iron, hardness) burdens. Although arsenic—a major Terai concern—is absent, the pervasive presence of coliforms renders 82 % of hand‑pumps unsafe without treatment. Addressing sanitary infrastructure, embracing chlorination and promoting deeper, better‑constructed wells are immediate necessities. Implementation of the above recommendations, alongside continuous monitoring, will protect public health and align the ward with Sustainable Development Goal 6 (safe water for all).
Prepared by:
Water‑Quality Assessment Team
Lumbini Agro Environment Laboratories Pvt. Ltd.
May 2024